In less than a week, the Iran/Israel shock has crossed a threshold. This is no longer a market driven mainly by geopolitical premium or a headline fear trade. It is now a market pricing physical interruption: blocked shipping, suspended LNG, higher tanker insurance, slower cargo rotation, and a sharper inflation impulse for importers that lack deep FX buffers.
That distinction matters because it changes what investors, policymakers, and operating businesses should watch. A classic fear trade is mostly about sentiment and can reverse quickly. An operational disruption behaves differently. Once tankers stop moving, export terminals shut, or insurers reprice routes, the shock migrates beyond oil futures into freight, power costs, consumer fuel bills, and sovereign financing conditions.
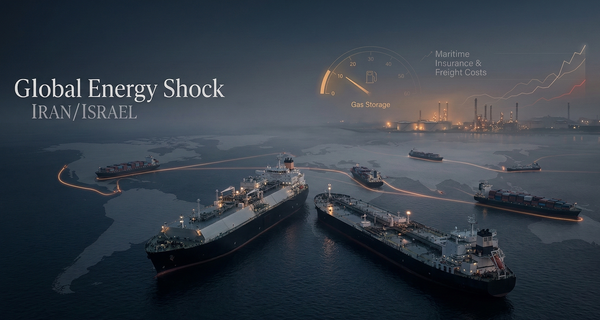
Shock dashboard
Selected repricing moves reported across oil, gas, fuels, and marine risk during the March 4 to 7 disruption window.
Marine insurance has moved on its own axis. Hull war-risk cover cited by Reuters rose from roughly 0.25% to around 3.0% of vessel value in some cases, which means the cost stack is now commodity price plus rerouting plus insurance plus delay plus working-capital strain.
Reuters reported on March 7 that around one-fifth of global crude and natural gas supply has been suspended as attacks on ships and regional energy infrastructure spread through the Gulf. Brent settled at $92.69 a barrel on March 6 after a 24% weekly surge, while Europe’s gas market jumped toward the low-€50s per MWh and U.S. gasoline prices rose sharply. Qatar, which supplies roughly one-fifth of global LNG, declared force majeure on exports after attacks on its facilities. Sources told Reuters that normalization could take at least a month. The story, in other words, is no longer simply that oil is up because war risk is higher. It is that the delivery system itself is under strain.
From crude price shock to cost-stack shock
The most important repricing may not be crude itself. It is the new cost stack that sits on top of any barrel or molecule still able to move: the commodity price, rerouting cost, war-risk insurance, port and loading delay, and the larger working-capital requirement needed to carry inventories while transit times stretch. Reuters reported that hull war-risk cover cited by brokers moved from roughly 0.25% of vessel value to around 3.0% in some cases. On a very large crude carrier, that is not a rounding error. It is a material new charge.
That shift is why this shock transmits more directly into inflation than a standard geopolitical headline rally. A refiner or importer may still secure supply, but at a much higher all-in landed cost. Airlines face a similar problem. Reuters reported that Singapore jet fuel prices jumped 140% from the February 27 close, underscoring how quickly middle-distillate markets can tighten when the system loses access to medium-sour Gulf crude and the shipping route that moves it.
Europe’s gas problem is timing, not just price
Europe does not need an immediate emergency declaration for this to become serious. Its problem is timing. Gas Infrastructure Europe showed EU storage at 29.52% full on March 6, while Reuters reported analyst expectations for end-March storage at only 22% to 27%, against a five-year average near 41%. Front-month Dutch TTF historical settlement data put the March 6 close at about €53.39/MWh, up from roughly €31.96/MWh on February 27, consistent with Reuters reporting that nearby European gas futures had risen close to 70% since the previous Friday.
Europe gas storage tracker
Europe’s issue is timing. Lower inventories make summer refill more expensive and raise next-winter risk.
Dashed line marks the five-year average end-March level.
Gas Infrastructure Europe showed EU storage at 29.52% on March 6. Reuters cited analyst end-March estimates of 22% to 27% versus a five-year average of about 41%.
That matters because Europe now relies heavily on LNG to balance its system. Reuters cited European Commission data showing Qatar accounted for 3.5% of EU gas supply in 2025, with the United States at 25.4%. Even if U.S. LNG remains the swing supplier, it cannot instantly replace missing Qatari cargoes. If Asian buyers also scramble for Atlantic Basin cargoes, Europe’s refill math becomes materially harder.
Asia is where logistics pressure becomes industrial pressure
Asia remains the cleanest case study in how a shipping shock becomes a real-economy shock. Reuters reported that the region sources around 60% of its crude from the Middle East. As Gulf flows slow, refiners have to compete for replacement cargoes from the United States, West Africa, and Latin America. Those barrels are available only with longer shipping times, tighter tanker capacity, and much higher freight expense.
The result is not just a higher crude bill. It is a squeeze on refinery runs, product export commitments, and industrial input costs. Reuters reporting this week showed Chinese refiners cutting runs, Indian refiners suspending some fuel exports, and Thailand suspending fuel exports. This is exactly the kind of transmission mechanism that turns a regional military conflict into a multi-region inflation and margin story.
Importer vulnerability matrix
Editorial exposure map based on energy import dependence, FX vulnerability, inflation sensitivity, and fiscal cushioning risk.
| Country |
Energy import dependence |
FX vulnerability |
Inflation sensitivity |
Fiscal subsidy exposure |
Likely near-term pressure |
| Turkey |
Very high |
Very high |
Very high |
Medium |
Very high |
| Egypt |
Very high |
Very high |
Very high |
Very high |
Very high |
| Morocco |
Very high |
Medium |
High |
Medium |
High |
| Jordan |
Very high |
Medium |
High |
High |
High |
| Kenya |
Very high |
High |
High |
Medium |
High |
| Senegal |
Very high |
High |
High |
High |
High |
| Thailand |
Very high |
Medium |
Medium |
Low |
High |
| Philippines |
Very high |
Medium |
High |
Medium |
High |
Methodology note: this matrix is an I-Invest exposure inference, not a claim that these countries have already taken emergency policy action. It is meant to identify where imported-energy stress is most likely to transmit into FX, inflation, and fiscal pressure first.
Importer watchlist: who breaks first if disruption persists
The most vulnerable balance sheets are not simply all net importers. They are net importers with weaker currencies, thinner reserve cover, politically sensitive pump prices, or subsidy exposure. Reuters cited Thailand and the Philippines among the most exposed economies in emerging Asia from a current-account perspective, while Turkey was flagged among lower-reserve countries at higher risk of capital outflows and currency slippage. The wider I-Invest watchlist also includes Egypt, Morocco, Jordan, Kenya, and Senegal because the same transmission channels apply: higher fuel import bills, inflation pressure, weaker local-currency debt performance, and pressure on public finances where governments cushion household energy costs.
This watchlist should be read as an exposure framework, not as proof that emergency policy action has already been taken. Some countries may choose conservation measures, FX smoothing, or targeted subsidy support, while others may absorb the pressure through prices, bond markets, and currency weakness. The point is to identify which systems have the least room for a persistent energy-import shock.
Exporters are not clean winners
It is tempting to divide the world into exporter winners and importer losers. That is too simple. Saudi Arabia and the UAE do have some bypass and rerouting options, and higher benchmark prices clearly improve headline revenue. But route congestion, insurance costs, delayed loadings, and the possibility of shut-ins all erode the benefit. Qatar is the clearest reminder that price upside can be overwhelmed by volume and timing risk. Nigeria benefits from higher prices without direct Hormuz dependence, but domestic execution risk still limits any neat “winner” story.
Exporter reality check
Higher prices help, but route and outage risk complicate the upside.
Saudi Arabia
Headline price upside: High
Shipping constraints: Medium
Route dependency: High
Net benefit confidence: Medium
Pipeline diversion helps, but does not erase shipping and insurance frictions.
UAE
Headline price upside: High
Shipping constraints: Medium
Route dependency: High
Net benefit confidence: Medium
Some bypass capacity exists, but Hormuz disruption still affects loading and timing.
Qatar
Headline price upside: High
Shipping constraints: Very high
Route dependency: Very high
Net benefit confidence: Low
Force majeure and LNG shutdown dominate the headline price upside.
Nigeria
Headline price upside: Medium
Shipping constraints: Low
Route dependency: Low
Net benefit confidence: Medium
Benefits from higher prices are real, but domestic execution risk limits clean upside.
What investors and allocators are actually repricing
The market is repricing more than oil. It is repricing physical delivery risk, LNG timing risk, marine insurance, aviation and freight input costs, inflation expectations, rate-cut assumptions, and the vulnerability of importer FX. Reuters also reported stress in European credit indicators, though not at levels that yet imply full market seizure. That distinction matters. This is a serious inflation-and-logistics shock, but not yet a systemwide funding freeze.
For allocators, the practical response is less about making a heroic macro call and more about balance-sheet discipline. The defensive posture still looks familiar: hold liquidity, keep duration flexible, prefer stronger currencies, and treat any energy exposure as targeted risk management rather than as a simple conviction trade. For operating businesses, the immediate questions are more concrete: how much fuel is hedged, how much shipping exposure is floating, how much working capital is needed if cargoes arrive late, and how much of the cost can be passed through.
What to watch next
The key markers are operational rather than rhetorical: whether tanker traffic through Hormuz normalizes, whether Qatar’s LNG restart timeline shortens, whether Saudi and UAE rerouting proves meaningful in practice, and whether import-dependent governments start leaning on subsidies, reserves, or FX management to smooth the shock. Until those indicators improve, this should be treated first as an energy logistics and inflation story, and only second as a crude-price story.
One final note on the stranded-barrels debate. Reuters has cited both a roughly 85 million-barrel estimate and a roughly 140 million-barrel figure. These are not necessarily contradictory. The lower number refers to stranded oil on tankers in one market estimate, while the higher number refers to suspended Gulf shipments in a broader Reuters framing. They measure different parts of the disruption and should not be used interchangeably without explanation.
Disclosure
This article is general information, not personal investment, tax, or legal advice. It reflects conditions and data available as of March 2026. I-Invest Magazine and the author do not receive compensation from entities mentioned unless explicitly stated. Readers should obtain independent professional advice before taking action.